Setup
This empirical example uses the CC0 Kaggle snapshot from Zhu (2021)
of Amazon book sales and weekly average sales ranks from 2001. The cleaned
snapshot is committed at data/incerto/snapshots/amazon_bookrank_2001.csv because it
is small and redistributable.
The example asks two related questions:
Does weekly sales volume have a heavy right tail?
Does the sales-rank relation look approximately log-linear, as one would expect from a rough power-law ranking rule?
The rank variable is inverse popularity: rank 1 is better than rank 1000.
Why book ranks suggest a tail question
Book sales are a natural “winner-take-more” setting. Most titles sell little in a given week, while a few sell much more. A rank is not the same object as a sales count, but if sales approximately follow a power law, a log-log plot of sales against rank can look close to linear over part of the range.
The important word is “approximately.” Amazon’s ranking algorithm is not a statistical law of nature, and this old dataset is small. The example is a real-data bridge from the Pareto pages to rank-size empirical work.
A descriptive log-log regression fits sales against ranks :
Here and the residuals are local regression notation; the fitted slope is not automatically a Pareto exponent.
Evidence and model comparison
There is no proof that the data are Pareto. The computation is a reproducible diagnostic:
Load the CC0 snapshot.
Plot weekly sales against weekly average rank on log-log axes.
Plot empirical sales survival on log-log axes.
Apply Hill Estimator sensitivity checks to positive weekly sales above a small reporting cutoff.
Any resulting exponent is sample-specific and should be read as an empirical description, not a structural parameter of Amazon.
Use load_amazon_bookrank, hill_alpha_estimator.
from xmath.incerto.datasets import load_amazon_bookrank
from xmath.incerto.estimators import hill_alpha_estimator

data = load_amazon_bookrank()
sales = data.weekly_sales[data.weekly_sales > 10]
print(f"Snapshot rows: {data.weekly_sales.size:d}")
for k in (10, 20, 40, 80, 120):
    print(f"{k} {hill_alpha_estimator(sales, k):.3f}")
Output
Snapshot rows: 861
10 3.670
20 2.509
40 2.270
80 2.116
120 2.066
Run in an editable checkout with the bundled CC0 snapshot; the estimates are threshold-sensitive descriptions of this sample.
Figure regeneration: uv run python demos/incerto/amazon_bookrank.py.
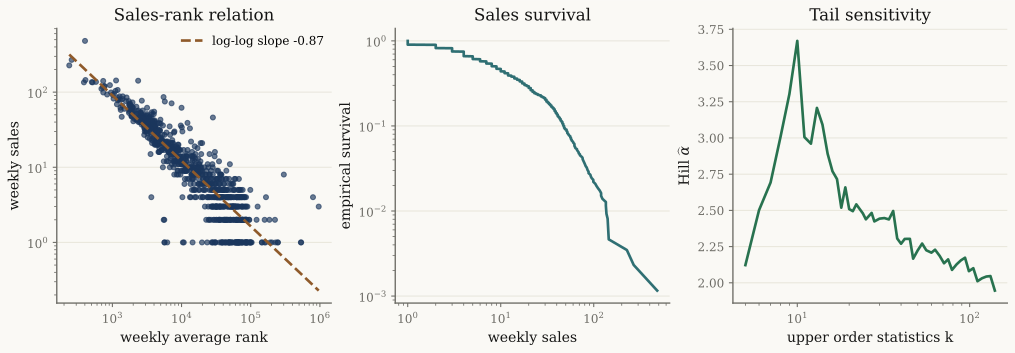
The log-log fit captures a broad rank-size direction, but the survival and Hill panels make the tail sensitivity visible. The calculation is a diagnostic bridge, not proof of a generative Pareto law.
Caveats
The snapshot is old and small. It should not be used to infer current Amazon ranking behavior.
The sample appears to be a narrow book universe rather than all books on Amazon.
A rank is generated by a platform algorithm and can be affected by time windows, category rules, stock status, and measurement conventions.
Weekly sales are discrete and bounded in this sample. That makes the far right tail short.
A log-log line over ranks is descriptive. It does not prove a generative Pareto mechanism.
References
Zhu (2021), “Amazon Book Sales VS Rank” Kaggle dataset.
Hill (1975), “A Simple General Approach to Inference About the Tail of a Distribution”.
Backlinks
Depends on: Pareto Distribution, Hill Estimator, and the shared tail notation in Notation.
Used by: rank-size and winner-take-more examples.
Recorded calculation
The committed demo produced the following on 2026-10-17. These are sample calculations, with seeds and sample sizes specified in the script.
Rows: 861; titles dated from 2001-04-21 to 2001-05-05
Log-log rank/sales R^2: 0.801
Hill alpha on sales > 10 for k= 10: 3.67
Hill alpha on sales > 10 for k= 20: 2.51
Hill alpha on sales > 10 for k= 40: 2.27
Hill alpha on sales > 10 for k= 80: 2.12
Hill alpha on sales > 10 for k=120: 2.07- Zhu, C. (Yuanmo). (2021). Amazon Book Sales VS Rank. Kaggle dataset. https://www.kaggle.com/datasets/yuanmozhu/amazon-book-sales-vs-rank
- Hill, B. M. (1975). A Simple General Approach to Inference About the Tail of a Distribution. The Annals of Statistics, 3(5), 1163–1174. 10.1214/aos/1176343247