Statement¶
Let be observed data, and compare the sample standard deviation with absolute-deviation scale estimates. The repository uses normal-scaled versions
and
For Gaussian data, both are calibrated to estimate the same as the standard deviation. Under fat-tailed or contaminated data, the ratios
can rise because sample standard deviation is more sensitive to isolated extremes. The mean absolute deviation uses all observations; the median absolute deviation depends on their central order statistics.
The sample notation and expectation notation follow the shared
notation table. The scale symbol and the
names MeanAD and MedianAD are local conventions for this page.
Examples¶
For Gaussian data, the standard deviation, normal-scaled mean absolute deviation, and normal-scaled median absolute deviation target the same , so the ratios should be near 1.
For Student-t or Pareto samples, large observations can push the standard deviation much higher than the absolute-deviation scales.
Use dispersion_ratios.
from xmath.incerto.stats import dispersion_ratios

for sample in ([2, 2, 2], [0, 0, 10], [1, 2, 3]):
    mean_ratio, median_ratio = dispersion_ratios(sample)
    print(f"{sample}: Std/MeanAD={mean_ratio:.4g}, Std/MedianAD={median_ratio:.4g}")
Output
[2, 2, 2]: Std/MeanAD=nan, Std/MedianAD=nan
[0, 0, 10]: Std/MeanAD=0.8463, Std/MedianAD=inf
[1, 2, 3]: Std/MeanAD=0.9772, Std/MedianAD=0.5507
The ratios distinguish from a positive numerator over a zero denominator.
Calibration¶
We justify the Gaussian scale constants here; these identities do not establish a tail class. Integrating the standard normal density on the positive half-line gives . The equation gives . Here is standard normal and is its density.
For ,
Thus multiplying the mean absolute deviation by calibrates it to under a normal model. Also,
so dividing the raw median absolute deviation by gives the same normal calibration.
These identities are normal-model calibrations, not tail theorems. If the sample has extreme observations, the standard deviation’s quadratic loss gives those observations much more weight than either absolute-deviation statistic.
Simulation¶
The simulation compares Gaussian, Student-t, and Pareto samples across sample sizes. It reports repeated-simulation medians of the two dispersion ratios.
Use dispersion_ratios.
import numpy as np
from xmath.incerto.stats import dispersion_ratios

rng = np.random.default_rng(20261020)
for label, sample in (("Normal", rng.normal(size=5000)),
                      ("Student 3", rng.standard_t(3, size=5000))):
    values = dispersion_ratios(sample)
    print(f"{label}: [" + ", ".join(f"{v:.3f}" for v in values) + "]")
Output
Normal: [1.003, 1.021]
Student 3: [1.175, 1.383]
These are sample diagnostics, not estimates of a tail exponent.
Figure regeneration: uv run python demos/incerto/dispersion_ratio.py.
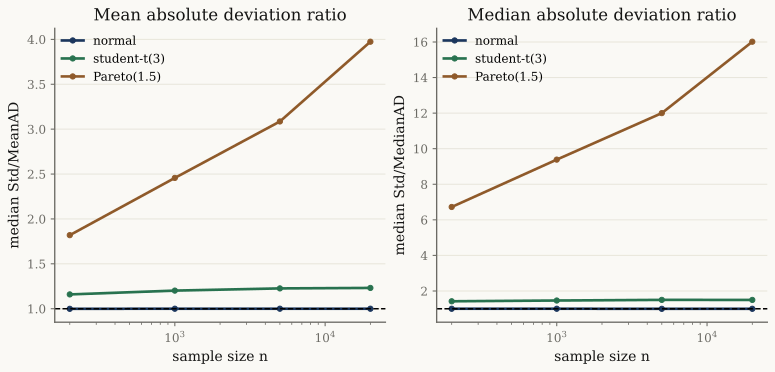
The Gaussian calibration explains why the simulated Gaussian ratios are near one. The Student-t and Pareto ratios are larger because the standard deviation is more sensitive to extremes than the absolute-deviation scales. The ratio is a stress signal, not a fitted tail exponent. The moment-estimation note explains why a finite population moment can still have an estimator with infinite variance.
Caveats¶
A high ratio is a diagnostic, not a fitted tail exponent.
The mean absolute deviation and median absolute deviation are scaled here to match a Gaussian standard deviation. Other conventions use unscaled values.
Median absolute deviation can be too robust for payoff questions where a rare outlier dominates the quantity of interest.
In an infinite-variance sample, the ratios are sample-path objects; the population variance does not exist.
Dependence and volatility clustering can move these ratios even when the one-step marginal distribution is unchanged.
References¶
Taleb (2025), Statistical Consequences of Fat Tails, third edition, 2025, ch. 4, §§4.4.1–4.4.3, printed pp. 79–84: dispersion comparisons. The Gaussian calibrations above are derived here.
Rousseeuw & Croux (1993), “Alternatives to the Median Absolute Deviation”.
Backlinks¶
Depends on: Variance Gamma Distribution and Body, Shoulders, and Tails.
Used by: robust-scale examples and tail-risk diagnostics.
Recorded calculation¶
The committed demo produced the following on 2026-10-17. These are sample calculations, with seeds and sample sizes specified in the script.
normal; n=200; median Std/MeanAD=0.999; median Std/MedianAD=1.001
normal; n=1000; median Std/MeanAD=1.000; median Std/MedianAD=1.002
normal; n=5000; median Std/MeanAD=1.000; median Std/MedianAD=0.997
normal; n=20000; median Std/MeanAD=1.000; median Std/MedianAD=0.999
student-t(3); n=200; median Std/MeanAD=1.159; median Std/MedianAD=1.421
student-t(3); n=1000; median Std/MeanAD=1.202; median Std/MedianAD=1.464
student-t(3); n=5000; median Std/MeanAD=1.226; median Std/MedianAD=1.500
student-t(3); n=20000; median Std/MeanAD=1.231; median Std/MedianAD=1.497
Pareto(1.5); n=200; median Std/MeanAD=1.819; median Std/MedianAD=6.723
Pareto(1.5); n=1000; median Std/MeanAD=2.457; median Std/MedianAD=9.386
Pareto(1.5); n=5000; median Std/MeanAD=3.086; median Std/MedianAD=12.000
Pareto(1.5); n=20000; median Std/MeanAD=3.974; median Std/MedianAD=16.015- Taleb, N. N. (2025). Statistical Consequences of Fat Tails (3rd ed.). https://arxiv.org/abs/2001.10488v4
- Rousseeuw, P. J., & Croux, C. (1993). Alternatives to the Median Absolute Deviation. Journal of the American Statistical Association, 88(424), 1273–1283. 10.1080/01621459.1993.10476408