Writing / 2024
A Simple Stock Market Trick: Use Logarithmic Charts
Why logarithmic stock charts make percentage changes easier to compare.
Image note: the original text’s positional references are retained; article images are collected at the end because their positions are unknown.
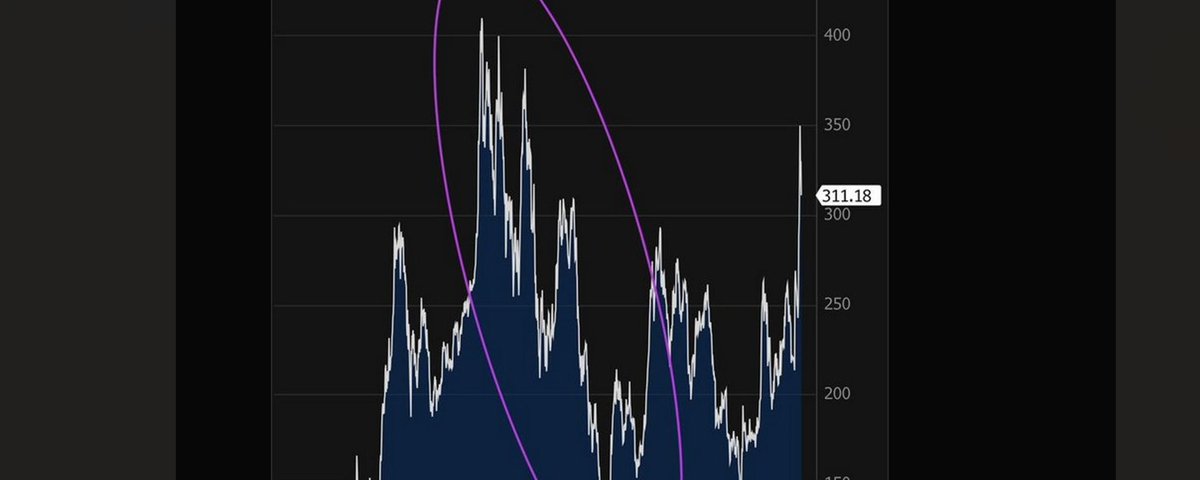
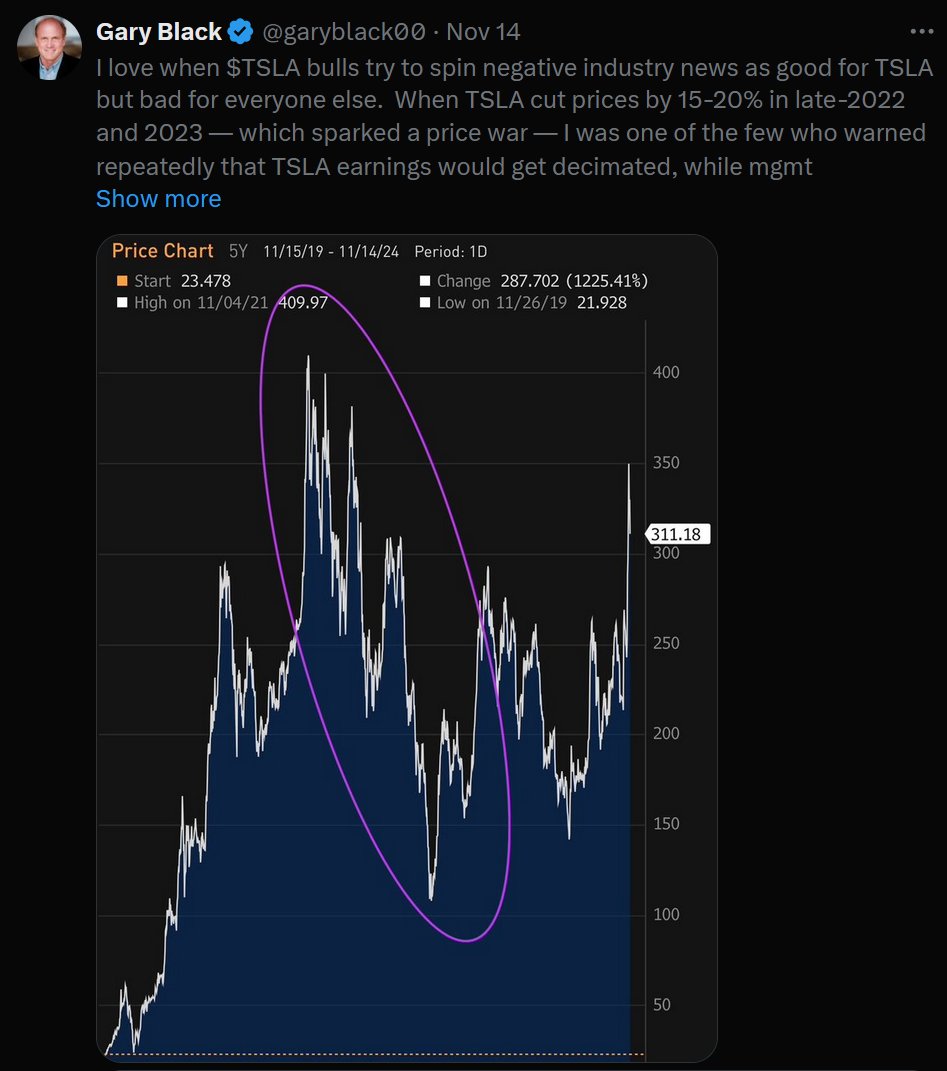
If you are active in the stock market, especially if you invest in Tesla, you inevitably come across posts like the one below.
Here is a very basic trick that surprisingly few people use. Whether you use technical analysis or value investing, whether you trade short term or invest long term, this trick will help.
Important things deserve to be said three times:
When looking at stock price charts, use a logarithmic scale!
When looking at stock price charts, use a logarithmic scale!
When looking at stock price charts, use a logarithmic scale!
What follows contains no mathematical formulas or theory.
How to use it
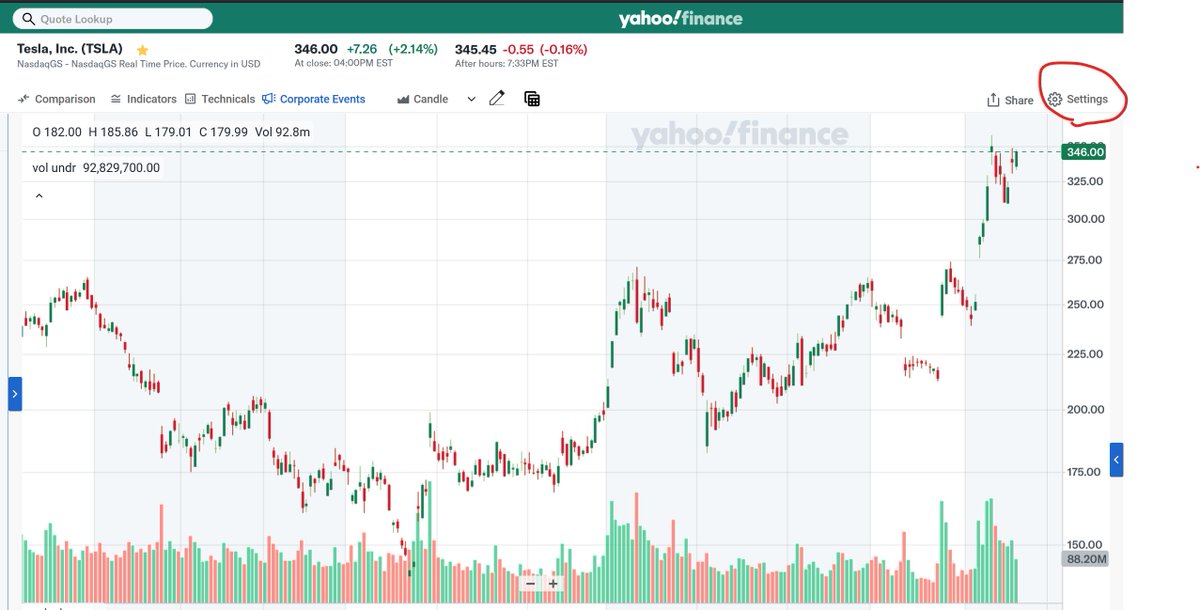
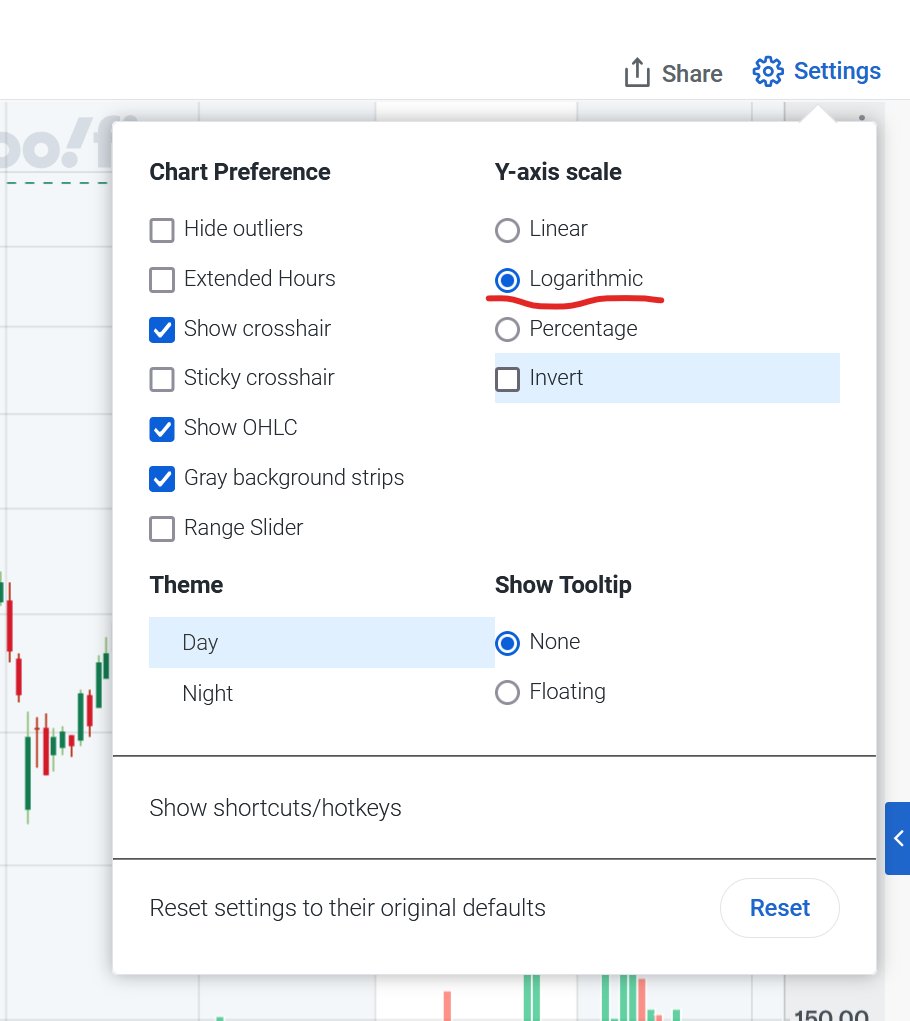
Take Yahoo Finance as an example. Click a stock chart to enter the page shown below. Click Settings in the upper right.
Then select Logarithmic, as indicated by the red line.
Why use a logarithmic scale?
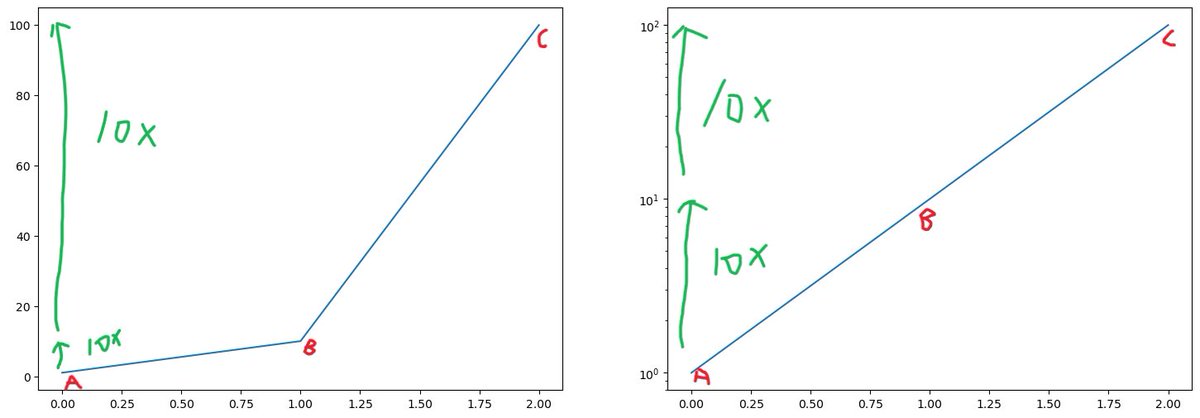
This article does not discuss any mathematical theory. Just visually, the biggest reason to use a logarithmic scale is that the same vertical distance represents the same percentage gain or loss at any point in time.
For example, in the chart above, a stock goes from 1 to 10, then from 10 to 100. Both are tenfold increases. Buying at point A and selling at point B gives you the same return as buying at point B and selling at point C. You cannot see this at all on a regular scale (left), but the distances are consistent on a logarithmic scale (right). Conversely, the losses from C to B and from B to A are also the same.
Because of this, when stock prices are displayed on a regular scale, the historical price movements you see, such as a 10% rise or a 10% fall, are distorted. A 10% fall a year ago does not look the same as a 10% fall today.
Technical investors
If you use technical analysis, you probably cannot resist the urge to draw all sorts of straight lines.
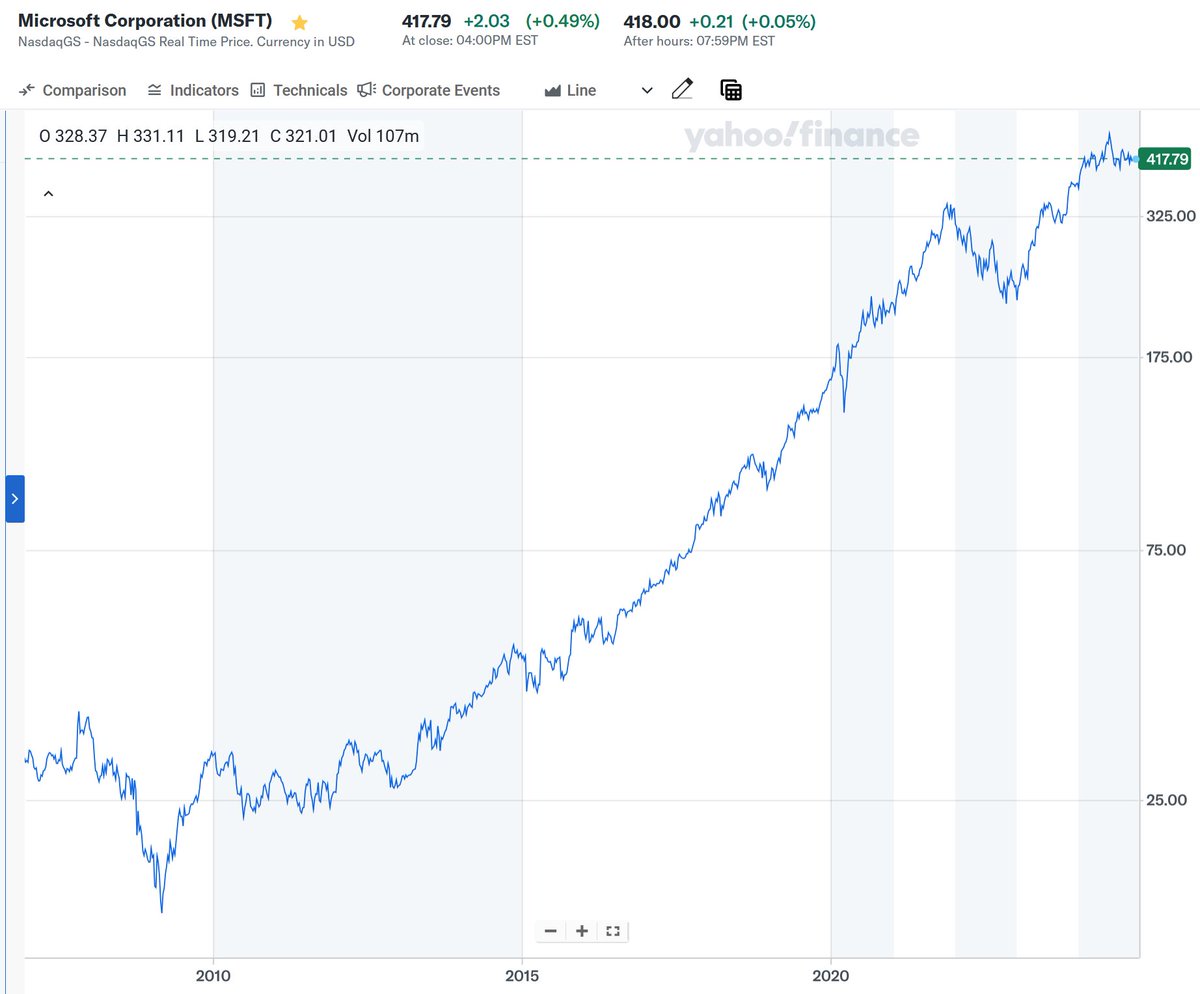
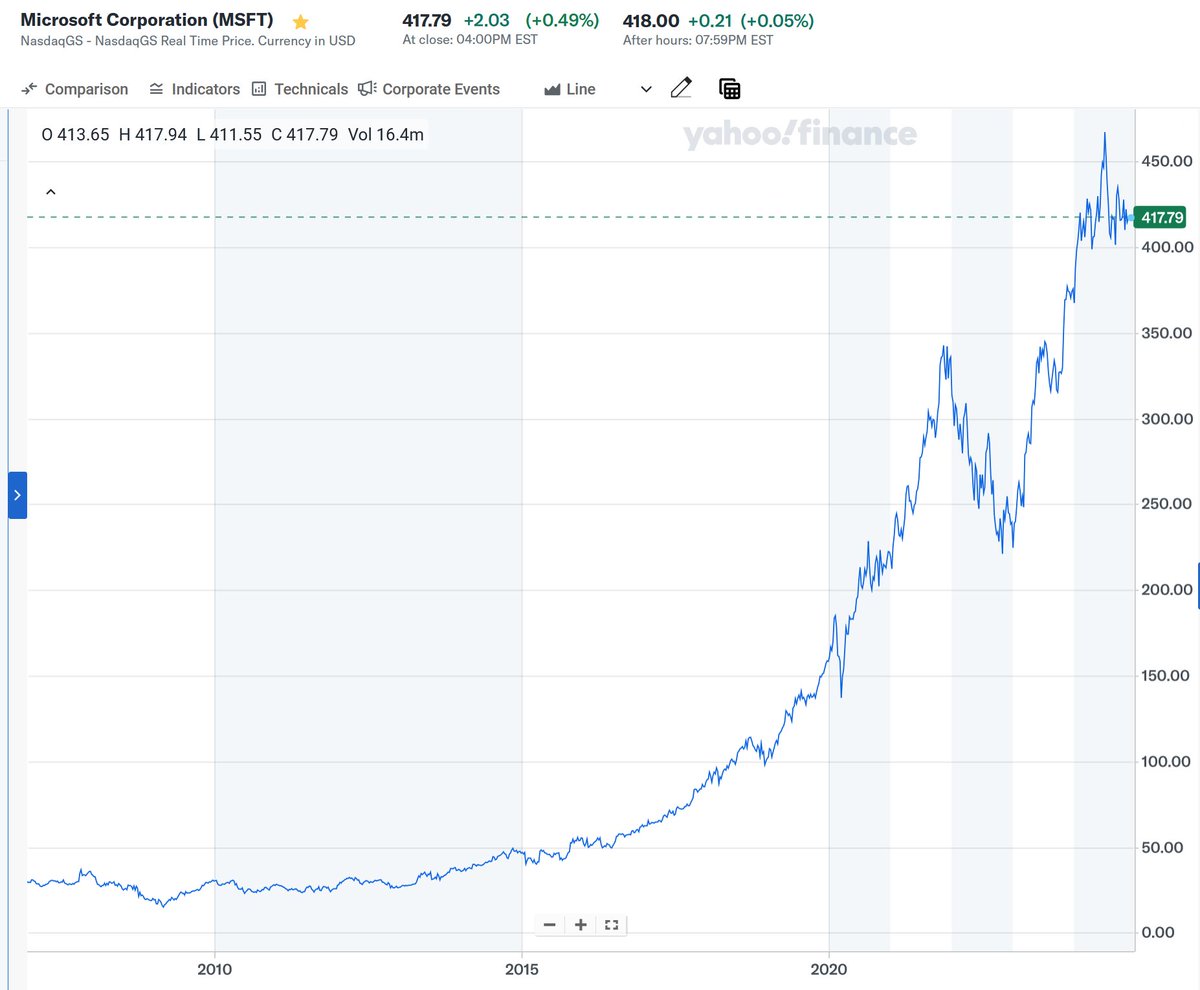
The following two charts show Microsoft’s stock price on regular and logarithmic scales. It is self-evident which one is better suited to drawing trends with “straight lines.”
Value investors
Why does this matter even to value investors who do not spend much time looking at historical data? Because it helps you judge what counts as “noise,” making it easier to hold stocks for the long term.
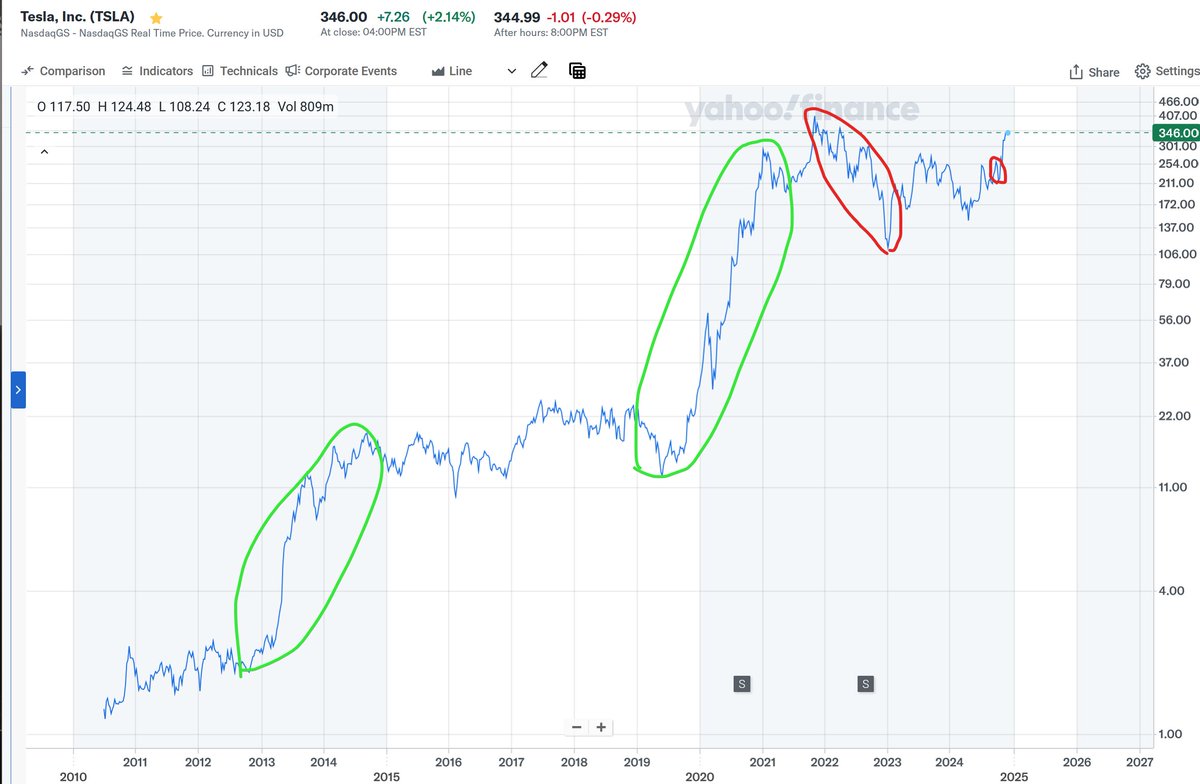
Back to that terrifying big circle Gary drew at the beginning. On a logarithmic scale, it becomes the red circle on the left below. The pitifully small red circle on the right is the “sharp” drop after the launch event that caused such a stir recently.
The logarithmic scale shows that Tesla’s real gains came in two periods, 2013–2014 and 2019–2021, both on the order of 10x. Most of the rest can be considered “noise.”
Images from the original
The images below follow the order supplied with the source; their positions in the original text are unknown.

This article was translated from the Chinese original posted on X.